Standard 8: data informed - tracking students
* LMS tools for tracking
Blackboard has many wonderful tools to help instructors track and monitor students. Many of my colleagues have found the retention center and performance dashboards very helpful. Although I do look at these from time to time, the tool that I have found most helpful is the color coding option for the gradebook. I am a visual learner who learns best by understanding global concepts first – so this tool is the one my mind is most able to utilize effectively (although I fully appreciate that the format is not one that would appeal to many people).
My tracking strategy is as follows:
Dark purple – 100%
Light purple – A
Dark Blue – B
Light Blue – C
Yellow – D
Orange – F
Red – below 10% (essentially, a missed assignment)
[I don't use green because that's my color for "needs grading"]
My tracking strategy is as follows:
Dark purple – 100%
Light purple – A
Dark Blue – B
Light Blue – C
Yellow – D
Orange – F
Red – below 10% (essentially, a missed assignment)
[I don't use green because that's my color for "needs grading"]
* Color coding allows me to quickly track individual students
* Color coding allows me to quickly track assignments
* Sorting by overall grades allows me to identify students at risk
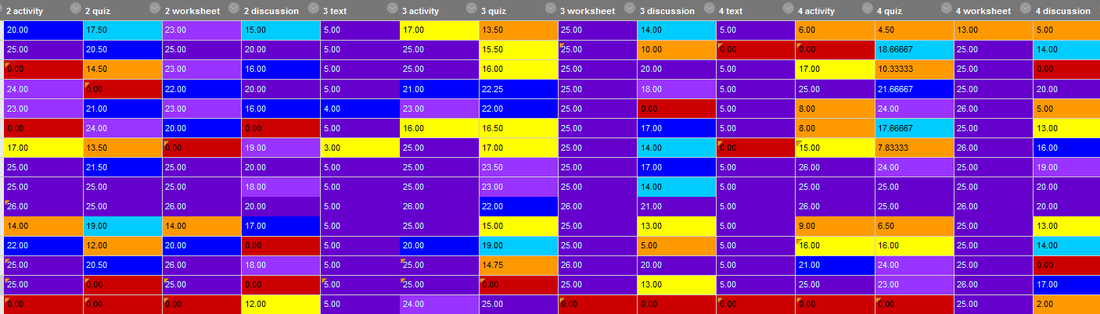
Using color coding allows me to track individual students as well as assignments that may be confusing or quizzes that may have been particularly challenging. I check the gradebook at least twice a week (once over the weekend and once after the Wednesday due date).
For example, I can quickly see that the individual in the bottom row has missed many assignments. I can send this student an email to see if all is well or if there is some life challenge they may be facing. I can also see that the individual in the top row is doing all of the assignments but has really struggled with this last unit (and has only been getting by in the previous units). I can send this student an email with a reminder that I am here to help and my office hours and contact information.
Not shown in this view is the overall grades (which are also color coded). I will often sort the gradebook by these grades to get a quick visual on students who are most at risk. Also not shown in this view is the “last access” column. I will also often sort by this column to see if there are students who have not accessed the class in over a week.
In addition to tracking student participation and performance, this color coding also allows me to keep up with the assignments and assessments in the course. Many of the assignments (“text”, “activity”, and “worksheet” columns) are set up so that students can get 100% if they put in enough time. I offer help and encourage them to use the Q&A forum to work through the assignments with me if they are finding them challenging. So, I expect to see a lot of dark purple in the assignment columns. However, students do not generally take the time to post questions, so the actuality is that a dark purple is an assignment students are able to complete well on their own. This is also part of the course design. I provide students many resources to help them complete the assignments; and although I am very happy to help students, my goal is to provide good enough resources so that they are able to complete the assignments with minimal questions. It does seem like this is the case for many of the assignments in this snapshot.
However, we can see that “4 activity” (the 4th column from the right) seems to have lower scores overall. This is a new activity I have designed in response to SLO data (which will be discussed in the feedback loop page of this standard). Although the SLO data shows that the change in activity format has increased quiz scores, this view shows that the activity itself is still rather challenging. In response to this, I will be developing an interactive tutorial for this topic (the first part of this tutorial can be seen in standard 2).
The discussion columns require students to discuss current events and ask for a bit more application and analysis than the assignments. I expect these grades to be more of a bell curve, and this view does seem to show that overall. The quizzes for this class are quite challenging and I expect these grades to be a bit lower. I explain to students that the overall grading scheme of the course takes this into account; so the quiz grades are balanced by the assignment grades. I use the quizzes as a direct assessment of what students can do on their own (without help from me or other resources). In this view it does look like quiz 3 is a bit challenging (especially in light of the fact that students who did well on the supporting activity still did poorly on the quiz). SLO data in the past and present indicates that quiz 3 has high overall grades, so I think this may just be an artifact of this sample – however, my strategy in the past when I have seen this sort of trend is to make sure the activity sufficiently supported the information in the quiz (and I will certainly do so here). Notice, for example, that in unit 4 the activity and quiz scores match fairly well (even though they are lower overall) – this tells me that a student’s ability to complete the activity indicates their ability to answer questions in the quiz. This correlation is an important one since the activities are meant to be direct practice for the quiz.
* Contact students with additional resources if needed
In addition to assessing my assignments and quizzes in this format, I can also assess if an individual student does well on the assignments but poorly on the quizzes. This would indicate a student who is willing to put in the time but is not fully comprehending the information. I would reach out to this student and ask them if there is anything I can do to help them study for the quizzes. In many cases, students are comfortable completing assignments but may not know how to study for tests. I have developed a study skills document (which is posted in the course). However, if I notice a student is struggling particularly with the quizzes, I might send them an email asking them to talk to me about how to study for quizzes. And, I would likely include the study skills document in this email as a lead-in to the discussion. The study skills document is attached below. [As I wrote this reflection, I realized that the document I've been using for years is too broad - it discussed labs, and tips for traditional classes. As a result, I just rewrote the document. This is a wonderful aspect of this practicum - sometimes just looking at things from a slightly different angle shows important aspects that were missed otherwise. Thank you!]
| study_tips_for_biology_online_b.pdf |
